Ketu in Magha: 9-Month Market Forecast for 2026 (March 29 to December 6)
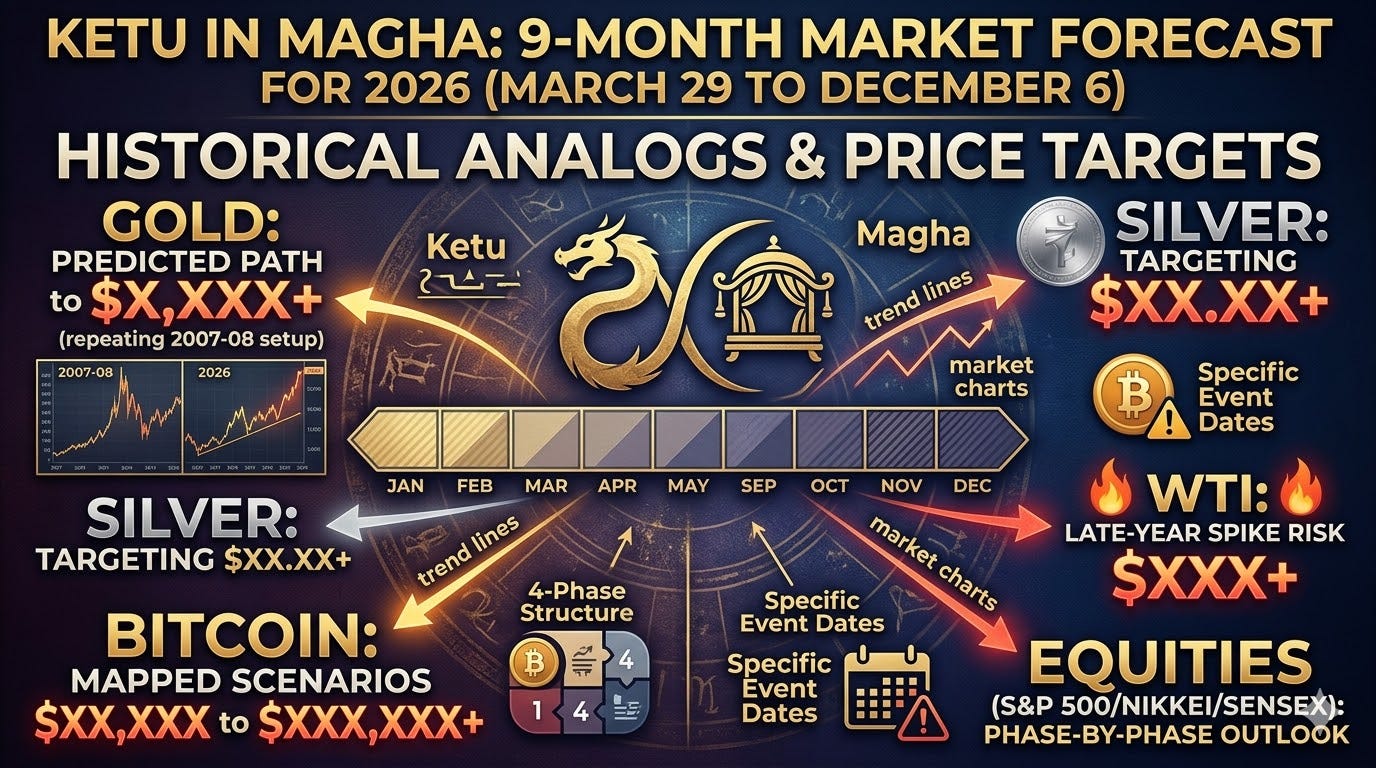
I mapped this transit against the 2007-08 cycle last week and kept staring at the same thing. The planetary setup that preceded gold’s run from $800 to $1,000, the one that produced a 27-year silver high, is repeating. Not roughly. Almost exactly.
Ketu moves into Magha nakshatra on March 29 and stays through December 6. Nine months, four distinct phases, and three specific dates I think will define where markets close out 2026. This article covers all of it with actual price levels.
Base prices as of March 25: Gold $4,566 | Silver $73 | WTI $86.86 | Bitcoin $71,925 | S&P 500 6,556 | Nikkei 53,749 | Sensex 23,306.
What’s Inside:
The four-phase structure and what each phase means for your positions
Gold and silver: where the primary move happens and the exact entry window
Bitcoin: both scenarios mapped with full price levels for each outcome
Crude oil and the late-year spike risk
Equities phase by phase, including Sensex sector rotation
The three specific dates that carry the highest event risk this year
What Makes This Transit Worth Tracking
Ketu is a mathematical axis point in Vedic astrology associated with sudden breaks from established patterns. When it transits Magha nakshatra, the historical record shows pressure on legacy institutions, government authority, and monetary structures.
The last three times this happened: 2007-08 (financial crisis, gold breakout), 1988-89 (S&L credit restructuring, currency repricing), 1969-71 (Bretton Woods collapse, gold peg erosion). Each one produced its largest precious metals move in the second phase of the transit. That pattern holds across three very different macro environments. It is the foundation of this forecast.
The Four Phases
The transit splits into four natural sub-periods. Think of them as separate chapters with different market characters.
Phase 4 (P4): March 29 to May 31. Slow institutional squeeze. Stress accumulates in financials, housing, and sovereign debt. Not explosive, but sets the conditions for everything after.
Phase 3 (P3): May 31 to August 2. Volatility spike mid-phase. The shock event lands around July 11. Bitcoin and equities most exposed. Gold holds.
Phase 2 (P2): August 2 to October 4. The primary precious metals move of the entire transit. Three tight planetary events in the opening 25 days. This is where the big gold and silver numbers come from.
Phase 1 (P1): October 4 to December 6. The most extreme phase. November 14 to 15 is the year’s highest-risk multi-asset window. Direction depends on what happened in Phase 2.
Phase 4: March 29 to May 31. Conditions Are Being Set
This phase does not produce dramatic price moves on its own. What it does is lay the groundwork. Financials, housing, and government debt sectors come under pressure through April and May. It is a slow grind where institutional cracks form beneath the surface, not a crash.
The planetary stack at Phase 4 entry includes Sun and Saturn together in Pisces (restriction and authority in a dissolution sign) and Jupiter building toward its exaltation entry on June 2. That Jupiter entry is what breaks the Phase 4 pressure open as Phase 3 begins.
Phase 4 asset ranges:
Gold: $4,400 to $5,000. Building base, upward bias, no parabolic move yet.
Silver: $68 to $78. Lagging gold, gold/silver ratio holding between 58 and 65.
WTI Crude: $78 to $95. Range-bound, demand narrative weak.
Bitcoin: $65,000 to $85,000. Consolidation, not a crash window.
S&P 500: 5,900 to 6,800. Wide volatile range, distribution character.
Nikkei: 50,000 to 57,000. Tends to lag US turns by 2 to 4 weeks.
Sensex: 21,500 to 24,500. PSU banking and housing finance under stress.
Nothing dramatic on price. But watch the financials and PSU-linked names in India. The stress is building even where prices do not confirm it yet.
Phase 3: May 31 to August 2. July 11 Is the Date
This phase has two distinct halves. Before July 11, markets absorb Jupiter’s exaltation entry on June 2 and generally hold. After July 11, the character changes sharply.
July 11: Venus exact conjunct Ketu at 0.06 degrees.
Venus governs financial markets, money, and commodity pricing. A 0.06 degree orb is extremely tight. This configuration historically produces fund closures, exchange disruptions, currency peg breaks, or surprise central bank announcements. The active risk window is July 8 to July 14.
The protecting factor: Jupiter is exalted during this window. That puts a floor under the damage. The historical comparison is closer to 1989 style (sharp drop, V-shaped recovery) than 2007 style (multi-month decline).
Mercury retrograde runs June 28 to July 22. Data released in this window gets revised materially later. Contracts and agreements signed carry reversal risk. Exchange and data infrastructure failures carry elevated probability.
Phase 3 asset ranges:
Gold: $4,800 to $5,500. Holds and extends through Phase 3. Buy the dip within the July 8 to 14 window. Gold is not the target of this shock, it is the safe harbor.
Silver: $72 to $90. Starting to activate late in Phase 3, setting up for the Phase 2 move.
WTI Crude: $80 to $105. Volatile, supply data distorted by Mercury retrograde.
Bitcoin: $45,000 to $58,000 flush risk. July 8 to 18 is the highest-risk Bitcoin window of the entire 9-month transit. Mercury retrograde combined with the Venus-Ketu conjunction raises exchange outage risk, smart contract failures, and custody issues significantly. Expect a 25 to 35% drawdown from the Phase 3 entry level within this window.
S&P 500: 10 to 15% correction followed by recovery. Nasdaq and tech take the hardest hit. Jupiter exalted cushions the recovery.
Nikkei: Sharp drop then recovery, mirrors the US but with greater force behind each move.
Sensex IT: Sharp single-leg drop in July. Infosys, TCS, Wipro most exposed.
Try This: If you hold Bitcoin going into June, set a hard stop or reduce position size before July 8. This is not a general bear market call. It is a specific 10-day event window tied to an unusually tight planetary conjunction. The recovery comes after. The timing matters.
Phase 2: August 2 to October 4. The Gold and Silver Move
Every Ketu-Magha cycle across the last 60 years produced its largest precious metals move in Phase 2. No exceptions.
2007-08: Gold ran from $800 to $1,000, a 25% gain. Silver hit a 27-year high.
1970: The Bretton Woods gold peg began its terminal erosion phase.
1989: S&L credit restructuring triggered FX and metals repricing across the cycle.
Three different macro backdrops. Same phase. Same pattern.
Three tight planetary events land in the first 25 days of Phase 2:
August 15: Mercury conjunct Jupiter exact at 0.03 degrees in Pushya nakshatra (Cancer). Pushya is called the nourisher in Vedic texts. Jupiter is still exalted at this point. Mercury in Pushya is associated with institutional capital flow into wealth-preserving assets. The week of August 10 to 20 is the highest-quality precious metals entry window of 2026.
August 22: Sun conjunct Ketu exact at 0.38 degrees. Sun is in its own sign (Leo). Ketu cutting across it produces an eclipse-like disruption to government and central bank authority. Most likely triggers: a Fed credibility shock, a US sovereign narrative break, a surprise monetary policy reversal, or a challenge to the dollar’s reserve currency role. August 22 is the single highest-probability day for a monetary authority shock in 2026. The week around this date is where the largest single-week gold move of the year most likely happens.
August 25: Mercury conjunct Ketu exact at 0.43 degrees. Three days after the August 22 Sun-Ketu event, Mercury adds an information confirmation layer. Expect an announcement or data release that amplifies whatever triggered on August 22.
Background during Phase 2: Saturn is in retrograde in Pisces, keeping persistent pressure on banking and debt structures. Venus goes retrograde around September 10 and stays there through early November, which reprices balance sheets and weakens growth equities while hard assets rise.
Phase 2 asset ranges:
Gold: $5,800 to $6,800. This is the primary move of the year. The August 22 week alone carries $150 to $300 single-session potential. Entry window: August 10 to 20.
Silver: $110 to $130. Silver outperforms gold in percentage terms in this phase, consistent across all three historical cycles. At gold $6,000 with a gold/silver ratio of 52, silver reaches $115. At gold $6,500 with a ratio of 50, silver reaches $130.
WTI Crude: $90 to $115. Mars in Gemini through August keeps supply-chain narratives volatile.
Bitcoin: $80,000 to $130,000. The monetary instability narrative following the Phase 3 flush drives the recovery. The shift from “risk asset” framing to “monetary hedge” framing is what powers this move.
S&P 500: 5,600 to 6,200. Flat to weak. Miners and commodity stocks outperform growth significantly during this phase.
Sensex: Gold-linked sectors lead. Titan and gold ETFs outperform. IT underperforms.
Try This: The August 10 to 20 entry window for gold and silver is the clearest setup of the year. The Mercury-Jupiter conjunction on August 15 followed by the Sun-Ketu event on August 22 gives you a buy-before-the-catalyst window that all three historical cycles confirm. If you act on only one thing in this article, that window is it.
Phase 1: October 4 to December 6. November Is the Wildcard
Phase 1 concentrates more planetary events in a shorter window than any other phase. Most of them hit within a single week.
The sequence going in:
October 4: Mars enters Cancer in a debilitated state. Forceful actions by leadership tend to backfire in this placement rather than achieve intended results.
October 31: Jupiter enters Leo and begins moving toward Ketu.
Around November 5: Venus retrograde turns direct, providing some financial market stabilization.
November 11: Jupiter exact conjunct Ketu at 0.05 degrees. A major institutional authority event. Likely triggers: central bank shock, political leadership exit, or a large institutional failure.
November 13: Mars enters Leo.
November 14 to 15: Mars, Jupiter, and Ketu all within 0.5 degrees. The most extreme multi-asset event of the entire transit.
The triple conjunction on November 14 to 15 brings Mars (speed, force, fire), Jupiter (scale, institutional weight), and Ketu (severance, explosion) within half a degree of each other. This produces a sharp, violent move, not a gradual slide. Peak impact lands within 3 to 5 trading days of November 14 to 15. The week of November 11 to 20 is the year’s highest-risk and highest-reward window across every asset class tracked here.
Phase 1 asset ranges:
Gold: $6,500 to $8,000 spike, then consolidation. Mars and Jupiter in Leo produce a blow-off top character.
Silver: $135 to $165 spike. Higher percentage gain than gold in the blow-off, consistent with historical Phase 1 behavior.
WTI Crude: $110 to $140 spike risk. Mars entering Leo on November 13 combined with the triple conjunction on November 14 to 15 makes a geopolitical supply shock the primary crude risk of the year.
S&P 500: 5,200 to 6,500 with extreme November volatility. A 5 to 8% single-session circuit-breaker event is possible around November 14 to 15.
Nikkei: A 5,000 to 8,000 point swing is possible in the November window. The year’s most extreme week for Japanese equities.
Bitcoin: Two scenarios. Covered in full below.
Bitcoin: Both Scenarios for Phase 1
Bitcoin is the one asset where the outcome genuinely forks depending on what macro conditions look like by October. The good news is you will know which scenario is active before November. There are clear, observable signals.
Scenario A: Monetary instability is dominant.
Conditions for this to be active: Gold above $6,000 by October, dollar in a confirmed downtrend, equities recovered from the Phase 3 correction.
In this case, Bitcoin holds its monetary hedge identity through the Phase 2 recovery. When the triple conjunction fires on November 14 to 15, Bitcoin gets pulled into the same explosive move as gold. Target: $150,000 to $200,000 in a 48-hour spike. Fast and violent, not a gradual trend.
Scenario B: Deflationary pressure is dominant.
Conditions for this to be active: Equities in a confirmed bear market by September, gold stalls below $5,500, dollar holds strength.
In this case, Bitcoin acts as a risk asset rather than a hedge into the Phase 1 event. The triple conjunction triggers capitulation. Target: $30,000 to $45,000 before medium-term recovery begins.
How to read which scenario is live: Watch gold and the S&P 500 through Phase 2 (August and September). If gold crosses $6,000 and equities recover from the Phase 3 correction, Scenario A is the working assumption. If equities remain in a bear trend through September, move to Scenario B. You have a 6-week window in August and September to assess this before November positions need to be set.
Crude Oil: Wait for October
Crude stays range-bound through Phase 4 and Phase 3 at $78 to $105. Supply data is distorted by Mercury retrograde in July, so do not over-read moves during that window.
Phase 2 sees crude at $90 to $115 as the Mars in Gemini narrative keeps volatility elevated, but this is not where the big crude trade is.
The real crude risk concentrates in Phase 1. Mars entering Leo on November 13, combined with the triple conjunction on November 14 to 15, is the setup for a geopolitical supply shock. The Phase 1 crude range is $110 to $140 spike risk. Not a base case for the full period. A specific, late-year event risk that is worth holding on your radar if you trade crude futures or energy equities.
Equities: Sector Rotation Over Index Level
The S&P 500, Nikkei, and Sensex all follow a broadly similar path through this transit: volatile range in Phase 4, sharp correction and recovery in Phase 3, flat-weak in Phase 2 as commodities take over, then extreme in the November window.
But the sector story matters more than the headline index. Magha nakshatra favors legacy, state-linked, and old-economy sectors throughout the full 9-month period.
In India: PSU banks, public sector companies, defence, and state infrastructure. Globally: old-line financial institutions, DAX legacy industrials, FTSE old-line financials, China state-owned enterprises, Japan’s old-economy Nikkei heavyweights.
Growth, technology, and new-economy sectors underperform this background, particularly in Phase 2 when Saturn retrograde in Pisces puts maximum pressure on banking and debt structures.
For Sensex: gold-linked stocks and ETFs lead in Phase 2 while the IT sector takes its sharpest single-leg down in July (Phase 3).
Try This: The Phase 2 sector rotation is one of the clearest positioning opportunities in this forecast. Reduce IT and high-growth exposure going into August. Add PSU/old-economy and metals-linked names before the August 10 to 20 entry window.
The Three Dates That Define 2026 Markets
If you track nothing else from this article, track these three.
July 11: Venus exact conjunct Ketu at 0.06 degree orb. The financial shock trigger of Phase 3. Highest-risk window for equities and Bitcoin is July 8 to 14. Gold holds and recovers. The severity of this event sets the recovery magnitude in Phase 2.
August 22: Sun exact conjunct Ketu at 0.38 degree orb. Monetary authority disruption. Dollar, Fed, or sovereign narrative shock. Most likely date for the largest single-week gold move of 2026. Entry window opens August 10.
November 14 to 15: Mars, Jupiter, and Ketu all within 0.5 degrees. The most extreme multi-asset volatility event of the year. Every major market sees its largest single-week move. Direction is determined entirely by the macro context Phase 2 builds.
What is your current positioning going into the March 29 start date? Overweight equities, sitting in cash, already in metals? I am curious which phase is most relevant to your current book. Reply and let me know.
This is part of the Ketu-Magha 2026 series. Weekly updates will track each phase as the transit progresses.
AstroVedicTime


