Why a Weak Dollar Is About to Make Gold, Silver, and Emerging Markets Explode
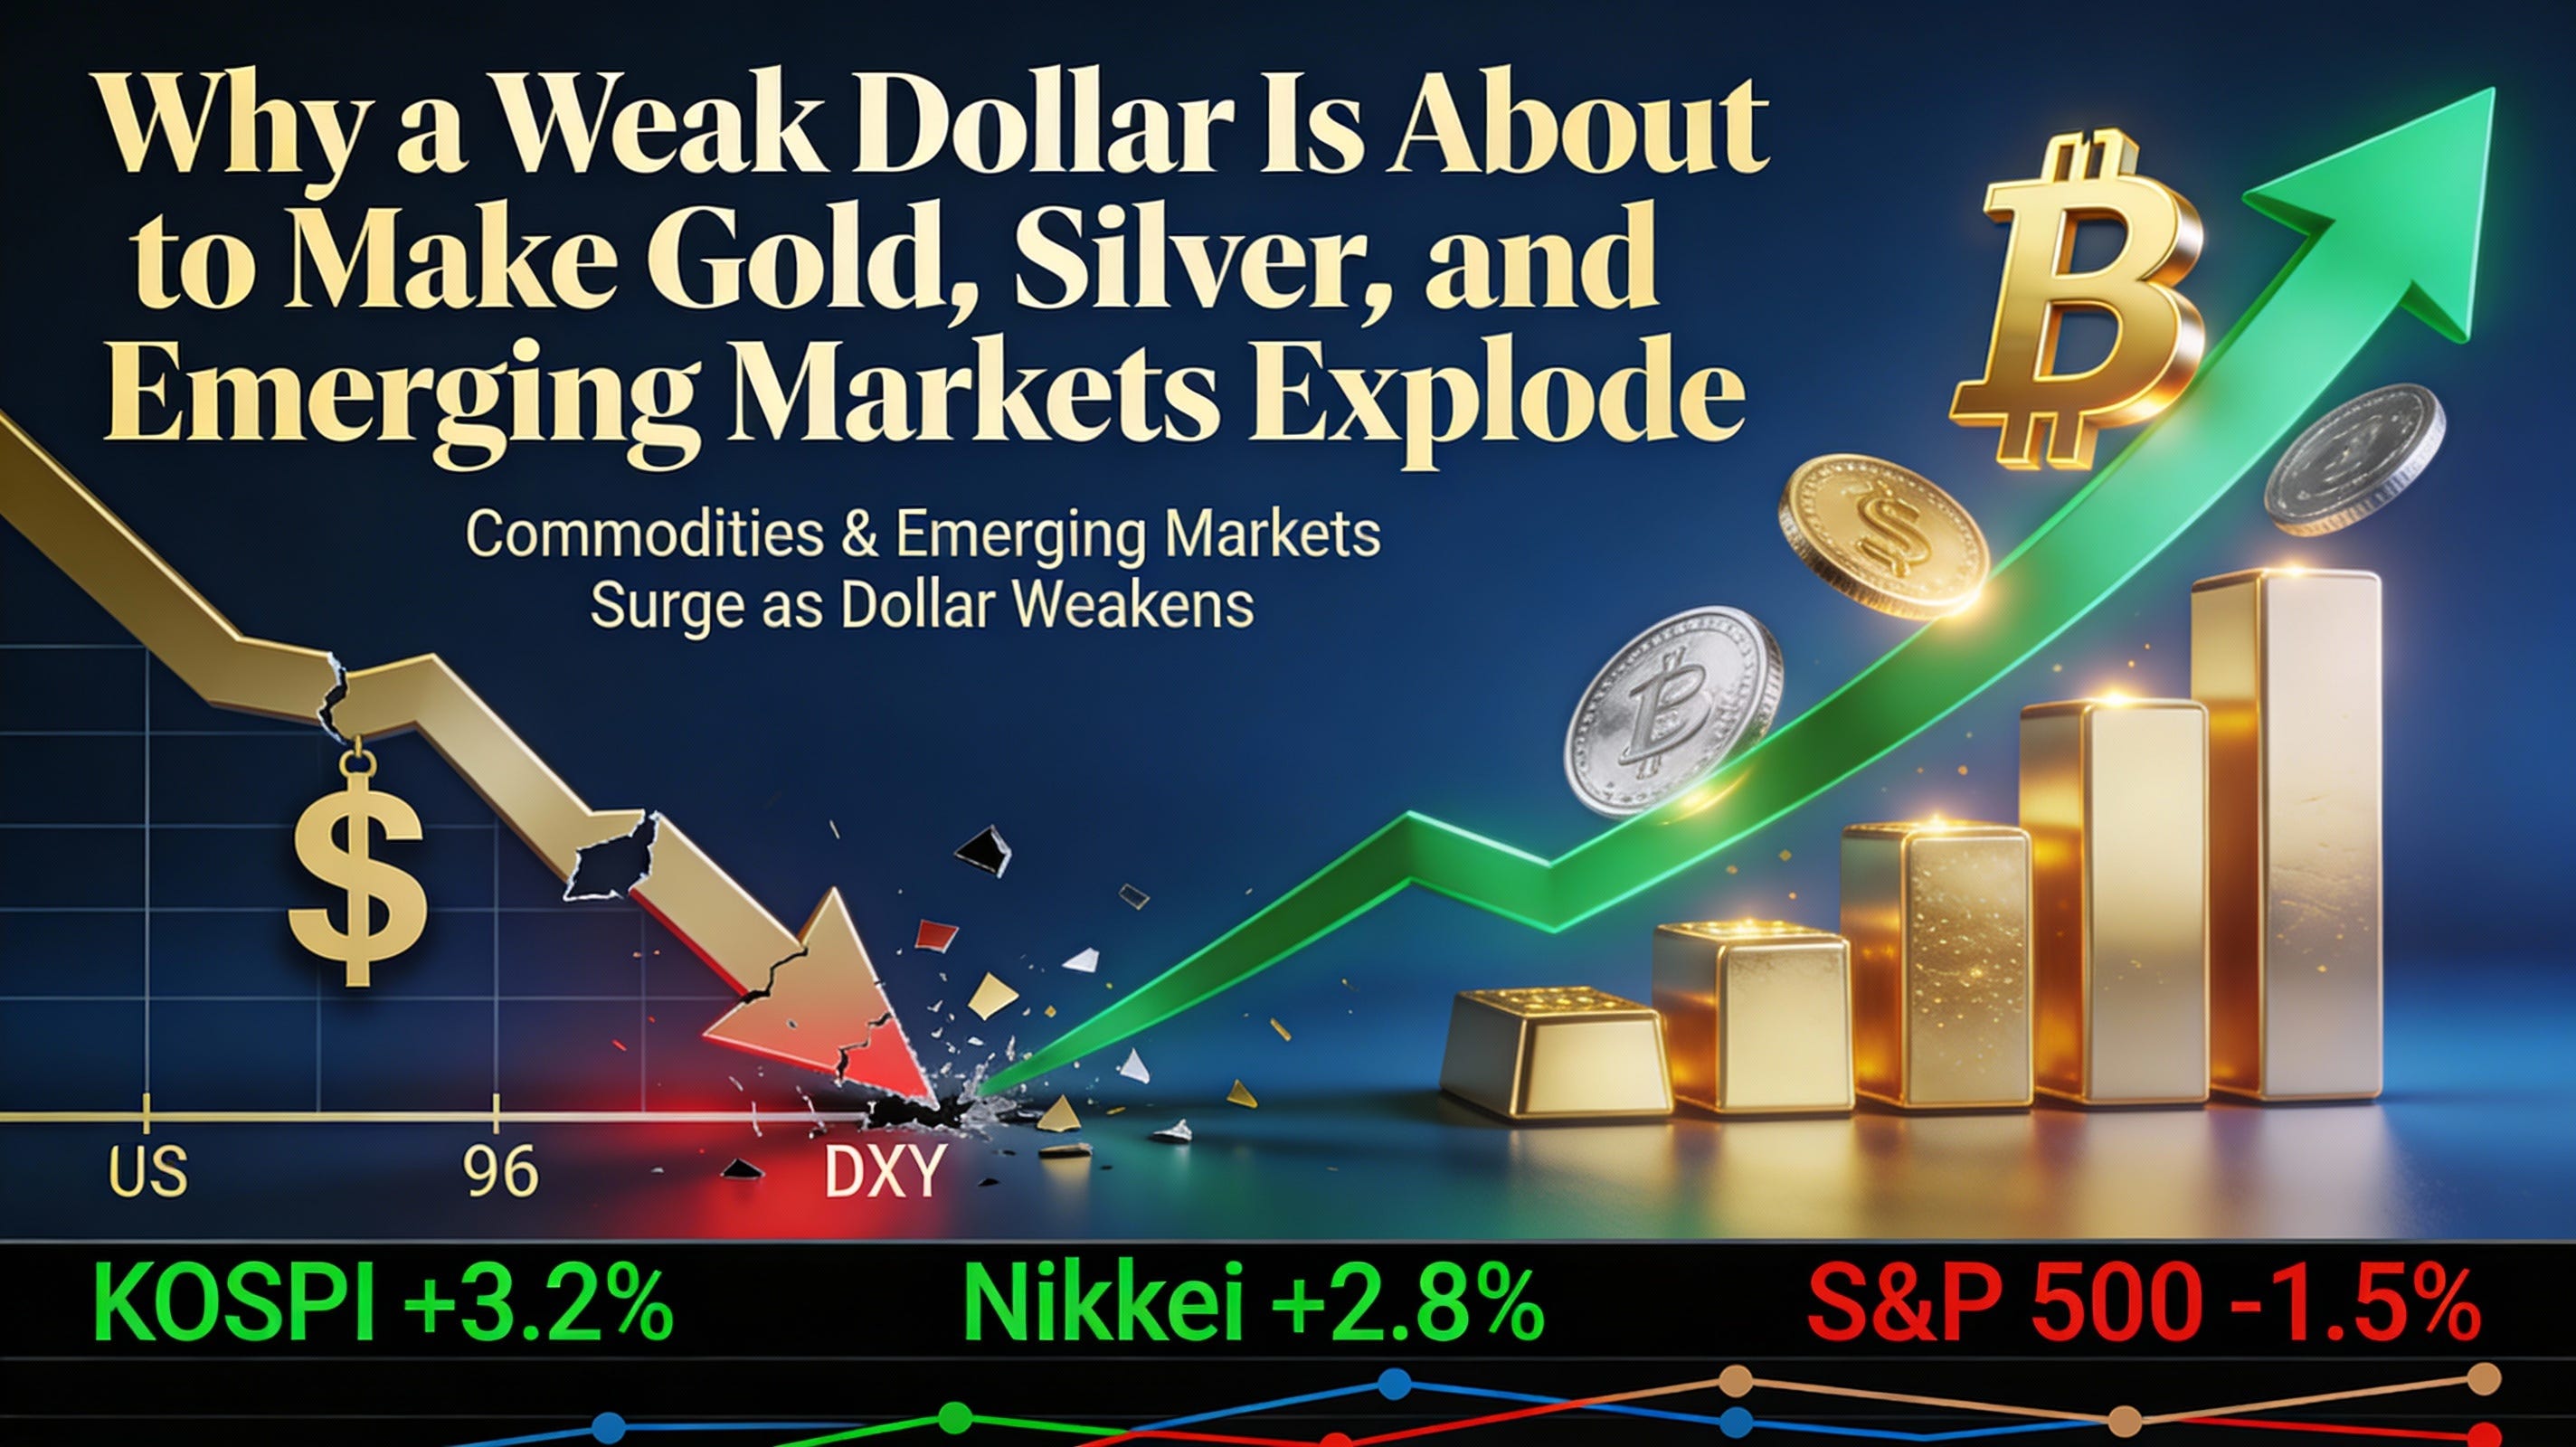
The US Dollar Index (DXY) just crashed below 96 for the first time since 2022. And if you’re paying attention, you should know what comes next: gold soars, silver surges, emerging market stocks rally, and crypto gains momentum. Here’s why this matters for your portfolio and why the rotation is just beginning.
The Dollar’s Historic Breakdown: Washington’s Deliberate Play
The dollar’s retreat isn’t accidental. Throughout 2025, the DXY fell nearly 10% from its peak of 110, and in early 2026, the Federal Reserve made its move: aggressive rate cuts, bringing the federal funds rate down to 3.50–3.75%. But here’s the part that matters: the White House isn’t hiding its intentions anymore.
The weak dollar is official policy. Recent tariffs, currency-checking with the Japanese Yen, and repeated signals from Treasury officials paint a clear picture, Washington is deliberately trying to devalue the USD to boost US manufacturing competitiveness. It’s a trade war accelerant.
This week, the dollar broke below the critical 96 level, a psychological barrier that hasn’t held since February 2022. Analysts are calling it a “crushing decline,” and the technical picture suggests the index could test 94 or even lower if Fed cuts accelerate.
But here’s what most investors miss: a weak dollar doesn’t hurt everyone. It destroys some assets while turbocharging others. And right now, capital is rotating out of the “US Exceptionalism” trade at an accelerating pace.
The Search for Yield: Why the S&P 500 Is Yesterday’s Trade
For the past three years, US large-cap stocks have dominated global markets on the back of AI hype, tight monetary policy, and the narrative that “America wins.” The S&P 500 posted 17.9% returns in 2025. That sounds great until you compare it to what happened elsewhere.
South Korea’s KOSPI surged 71.2% in 2025 - crushing the S&P 500 by over 5,000 basis points. Japan’s Nikkei 225 delivered 26.3% returns. Brazil’s Bovespa added 33.4%. Even Hong Kong’s Hang Seng Index, a market many US investors have written off, returned 28.7%.
The reason? The search for yield. With US Treasury yields falling and the Fed slashing rates from 5.25% to 3.50%, the returns available from US bonds and large-cap stocks look miserable compared to emerging markets. A dollar-denominated bond yielding 3.5% is no longer attractive when you can access a 12% return in an Indian bank stock or a 10% dividend from a Korean semiconductor producer.
Fund managers aren’t making this rotation because it’s fun. They’re doing it because it’s mathematically necessary. The cost of capital in developed markets is plummeting, while emerging markets still offer real returns. Capital flows follow returns. And in 2026, those flows are turning into a tsunami toward Asia, Latin America, and frontier markets.
The question isn’t whether the S&P 500 will rally, it will. The question is whether it will beat the alternatives. The answer is no. Investors who remain overweight in US-only large caps are fighting the tape.
Gold and Silver: The Safe Haven Rallies That Keep Running
If you own gold, you’re already ahead. The yellow metal is trading at $5,544/oz, with all-time highs confirmed earlier in January. This represents a staggering 100%+ gain from lows just three years ago.
This is textbook weak-dollar behavior. When the dollar weakens, foreign buyers pay less for gold and silver (since these metals are priced in dollars globally). The correlation is brutal: every 1% drop in the dollar typically pushes gold up 1.15%. But that’s only part of the story.
The real fuel is the Fed’s easing cycle. Lower interest rates mean bonds generate meager returns. Gold, which pays nothing, suddenly becomes attractive because it preserves purchasing power without the risk of inflation eroding your savings. Central banks around the world are hoarding gold too, especially in emerging markets. Supply is tight. Demand is relentless.
Gold Outlook:
Current: $5,544/oz
Bull case (30% probability): $5,500–$6,000 by Q4 2026
Consensus case: $5,020–$5,200 by Q4 2026
Structural support: Fed easing, central bank accumulation, geopolitical hedging
But here’s the thing: gold prices have already run hard. The real opportunity now lies in the assets that follow gold, the miners that produce it, and the silver that tags along.
Silver offers a dual benefit. First, it’s silver, a precious metal with the same weak-dollar tailwinds as gold. Second, it’s an industrial metal. Solar panels, electric vehicle components, RFID tags, touchscreens, global demand for silver is surging as the clean energy transition accelerates.
Silver is trading at $117–$118/oz currently, having surged 275% from a year ago.
Silver Outlook:
Current: $117/oz
Conservative targets: $58–$68/oz by end-2026 (analysts like JP Morgan, Bank of America, HSBC), but these were set before current momentum
Aggressive targets: $100–$200/oz by end-2026 (Robert Kiyosaki, Citigroup for March 2026)
Realistic 2026 target: $150–$180/oz (+28–54% upside)
Drivers: Industrial demand from renewables, fifth consecutive year of supply deficit, China export controls on silver, central bank buying
The precious metals complex - gold, silver, platinum, and palladium - are now in a structural uptrend that should extend through 2026 as long as the DXY stays below 97.
Industrial Metals: The Supply Crunch Is Real (And Already Priced In)
While precious metals benefit from safe-haven demand, industrial metals benefit from something more tangible: yesterday’s targets are today’s baseline.
Copper: Already Exceeded Consensus
Current: $12,990/tonne (~$5.90/lb)
Peak: $13,330/tonne earlier this month (record highs)
Original target: $13,600–$15,200 by Q3 2026 - now achieved early
Revised upside: $15,200–$16,500/tonne by Q4 2026 (+16–27% from current)
Driver: AI data center demand creating 600,000-tonne supply deficit in 2026
Aluminum: Already Broke Through Ceiling
Current: $3,300/tonne ($1.48/lb LME base) / $2.45–$2.50/lb with US Midwest Premium
Original target: $2,200–$2,400/tonne - surpassed in Q1 2026
Revised target: $3,600–$3,900/tonne by Q3 2026 (+9–18% from current)
Driver: Aviation, automotive, construction, and renewable energy demand all strong
Zinc: Tracking Perfectly Within Range
Current: $3,360/tonne (~$1.52/lb)
Target range: $1.40–$1.65/lb
Status: Comfortably positioned for $1.60–$1.75/lb by Q3 2026 (+5–15% upside)
Driver: Low inventory levels, automotive sector recovery
Nickel & Palladium: Surprise Outperformers
Nickel: Essential for EV batteries, seeing Chinese buyouts and strategic stockpiling
Platinum: Bank of America raised 2026 average forecast to $2,450/oz (already hit in spot markets)
Palladium: Hit $2,113/oz on January 29, 2026 - up 107% year-over-year. Bank of America raised forecast to $1,725/oz average (conservative given current prices)
The Macro Context: Your original targets were considered “bullish” when published. They’re now the baseline. This is a structural supply crunch where “yesterday’s high” is becoming “today’s floor.” Copper supply deficit of 600,000 tonnes this year, combined with weak dollar making imports cheaper for non-US buyers, creates a perfect storm for higher prices.
Emerging Markets Equities: The Rotation Is Just Beginning
Here’s where it gets interesting. During weak-dollar periods, emerging market stocks historically crush developed markets by 300–400 basis points annually. We saw this from 2002–2007, when the dollar weakness drove emerging markets up 382% cumulatively, annualized returns exceeding 37%.
The current rotation is following that playbook perfectly. MSCI Emerging Markets has seen $16.3 billion in monthly inflows (the highest in over a year), and the outflows from US-focused funds are accelerating.
Why? Three reasons:
First: Currency Tailwinds. When the dollar weakens against emerging market currencies, US-based investors get a bonus return just from currency appreciation. If you hold Indian or Brazilian stocks and their currencies strengthen against the dollar, you win twice, once from the stock price rising and once from the currency move. In a typical weak-dollar scenario, EM currencies appreciate 8–12% against the dollar. That’s an additional 8–12% return for US investors before a single share price moves.
Second: Debt Relief. Many emerging markets carry dollar-denominated debt. When the dollar weakens, the real burden of that debt shrinks. Suddenly, those countries look financially healthier, and equity valuations improve. Government balance sheets strengthen, reducing default risk and sovereign spreads compress, benefiting all EM-based businesses.
Third: Manufacturing Cost Advantages. Many emerging market companies export products priced in dollars. When the dollar is weak, their exports become more competitive. Their profit margins widen. Revenue growth accelerates. A Brazilian exporter, an Indian IT services firm, or a Korean semiconductor maker all benefit directly from a weaker dollar.
The data is compelling: the average emerging market stock trades at a 30–40% discount to developed markets on price-to-earnings multiples. That’s deep value. Add in the structural tailwinds from weak dollar, better growth (India is hitting 8–9% GDP growth), and central bank liquidity support (China and India are both easing), and you have a set-up for 15–20% annual returns.
Regional leaders for 2026:
India: The strongest fundamental opportunity. 8–9% GDP growth, massive tech-to-manufacturing tailwinds, and foreign investor interest hitting highs. MSCI India could see 20–25% returns.
Brazil: Weak real currency benefits exporters. Commodity prices are supported by weak dollar. Central bank is holding rates steady, avoiding further tightening. Bovespa target: 130,000–140,000 (up 10–15%).
Emerging Asia ex-China: Taiwan, South Korea, Thailand - tech exposure with currency tailwinds. Korea’s KOSPI has already surged 71% in 2025, but it has room to run given its valuation discount to the US and superior earnings growth.
China: Improved economic backdrop with stimulus potential if growth falters. Hang Seng Index already up 28.7%, but the setup remains constructive.
The weak dollar isn’t just supporting EM equities- it’s making them mathematically attractive for the first time in a decade.
Bitcoin and Crypto: Institutional Adoption Meets Supply Squeeze
Bitcoin has shown a fascinating correlation with the dollar: when DXY falls, crypto rises. The inverse correlation runs -0.4 to -0.8, meaning they move in opposite directions reliably. But the real story in 2026 isn’t just risk appetite- it’s institutional adoption meeting a structural supply squeeze.
Bitcoin currently trades around $89,000–$90,000 after pulling back from October’s peak of $126,000. But here’s what’s important: the narrative has shifted from “speculative bubble” to “institutional asset class.” BlackRock’s Bitcoin ETF (IBIT) now holds nearly $70 billion in assets- about 4% of all Bitcoin in existence. That’s real capital, not retail gambling.
However, something fascinating is happening with Bitcoin ETF flows. In late January 2026, Bitcoin ETFs recorded outflows of $1.1–$1.6 billion over five consecutive days - the heaviest weekly outflow since early January. This looks bearish on the surface, but here’s the hidden signal: the outflows are concentrated.
Just three ETFs account for 92% of the outflows: Grayscale Bitcoin Trust (GBTC), Fidelity Wise Origin Bitcoin Fund (FBTC), and 21Shares Ethereum ETF. These are institutional products. The outflows suggest institutional profit-taking and rotation - not capitulation.
Here’s the critical insight: When institutional capital exits Bitcoin ETFs to lock in gains, it doesn’t disappear. It redeploys elsewhere, typically into newer crypto assets or back into spot Bitcoin held in custody. This creates a supply squeeze. Fewer Bitcoin available to buy in the open market, while demand from new institutional entrants (endowments, pensions, insurance) continues to grow.
That supply squeeze is what creates the structural catalyst for the $150,000–$225,000 Bitcoin targets analysts are calling for by mid-2026. It’s not just “risk appetite”, it’s a legitimate supply-demand imbalance.
Bitcoin Outlook:
Current: $89,000–$90,000
Target Q2 2026: $120,000–$150,000 (+33–67% upside)
Target Q3-Q4 2026: $150,000–$225,000 (+67–150% upside if Fed easing accelerates)
Structural driver: Institutional adoption + ETF supply squeeze + weaker dollar
Additionally, institutional adoption is accelerating. Pension funds, endowments, and sovereign wealth funds are beginning to allocate 0.5–2% to crypto as a diversification hedge against currency debasement. That’s a structural tailwind that lasts for years, not months.
The DXY below 96.2 creates the psychological catalyst. The Bitcoin ETF flows create the technical setup. Institutional adoption provides the fundamental case. These three factors converging suggest Bitcoin could genuinely reach $120,000–$150,000 before Q3 2026, with a potential path to $225,000 if Fed easing accelerates further.
What Could Go Wrong: The Powell Succession Shock
This entire thesis rests on one assumption: the Federal Reserve continues to ease monetary policy. But in May 2026, that assumption faces a critical test.
Jerome Powell’s term as Fed Chair ends on May 15, 2026. And right now, his successor is not yet named.
President Trump is expected to announce his pick in January 2026, with a likely successor in place by late spring. The shortlist includes Kevin Hassett (Trump’s chief economic advisor and a hawk-turned-dove), Kevin Warsh (former Fed governor, market-friendly), Christopher Waller (centrist), Michelle Bowman (dove), and Rick Rieder (BlackRock executive).
Here’s the problem: If Trump nominates a hawk like Hassett, there’s potential for the Fed to pause or reverse rate cuts. Hassett has historically advocated for lower rates, but his appointment would bring policy uncertainty and a potential “flight to safety” back into the dollar. The Senate confirmation process could also create volatility, the next Fed chair might face a tighter confirmation vote than Powell did, given Trump’s overt attempts to influence the Fed.
If there’s even a hint that the next Fed chair will be restrictive, capital will rotate back into dollar assets, and the weak-dollar thesis collapses. Metals, EM equities, and crypto would all face headwinds.
That said, the market is pricing in continued easing. Fed futures show rate cuts through 2026 and into 2027. Unless there’s a surprise inflation spike (tariffs, energy shock), the Powell succession is unlikely to derail the weak-dollar trade, but it’s a key risk to monitor.
The Real Alpha: Positioning for the 2026 Regime
The weak dollar isn’t just a forecast; it’s the 2026 regime. With gold holding $5,544 and the Fed facing internal pressure to cut further, the “Dollar Smile” has inverted. Investors who remain overweight in US-only large caps are fighting the tape.
The real alpha is moving to the fringes: precious metals rallying on safe-haven demand and weak-dollar tailwinds, industrial metals constrained by supply, emerging economies finally unshackled from dollar-denominated debt servicing, and crypto benefiting from institutional adoption and a tight supply of new Bitcoin.
A simple 2026 portfolio allocation:
35% Precious Metals & Miners (gold, silver, major mining ETFs)
25% Emerging Market Equities (focus: India, Brazil, Asia ex-China)
15% Industrial Metals & Materials (copper, aluminum, mining companies)
15% Crypto (Bitcoin and Ethereum, via institutional-grade ETFs)
10% Dividend-Paying Developed Market Equities (value, not growth)
This allocation assumes the weak-dollar regime persists through 2026 and the Fed continues easing. It also acknowledges the currency and supply tailwinds that support each asset class independently of macro narratives.
The key insight: Your original targets weren’t too aggressive, they were too conservative. Copper has already hit $13,330/tonne, surpassing the $13,600–$15,200 range. Aluminum broke through $3,300/tonne, well above the $2,200–$2,400 forecast. Silver at $117/oz is pricing in a move to $150–$180. Palladium at $2,113/oz has already exceeded analyst forecasts.
This isn’t momentum. This is structural. The supply deficits are real. The weak dollar is accelerating. The institutional adoption is happening. And the rotation away from US exceptionalism has only just begun.
The rotation is already underway. Fund managers have $16.3 billion in monthly outflows rotating into emerging markets. Foreign stock indices are crushing the S&P 500. Gold is at all-time highs. Copper has hit record highs. And Bitcoin is positioning for a move toward $150,000+ as institutional capital enters the space.
You can fight this trend or ride it. In 2026, the trend is clear: weak dollar, strong commodities, strong EM equities, and strong crypto. Position accordingly.


